Okay, first an upfront explanation of why we are even blogging about this. We are a web-based business that generates vast amounts of data. We continuously monitor and analyze our data, and even sometimes blog about what we find. So when we saw that a blog from OKCupid was the source of headlines such as, "The Curse of Being Cute" we had to see what they had done with their data. They did this.
OKCupid is an internet dating site. They have millions of users, and their users have rated each other on attractiveness (on a 1 to 5 scale, low to high) and sent messages to each other. Of course getting a lot of 5s was most predictive of getting lots of messages. A second claim by the company, and the one getting most of the attention, is that being rated 1 was the next best thing to being rated 5 when it comes to getting more messages, and being rated 4 could even have a negative impact on the flow of messages. Hence the "curse of cuteness" and the discussion that being being polarizing can be beneficial.
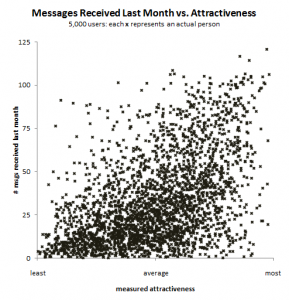
To translate it to an employment setting, let's suppose that on a job search site, prospective employers can rate potential applicants on a 1 to 5 scale. And suppose that it's also possible to track the number of interview offers made to job applicants. Then here is the graph offered up by the folks at OKCupid:

Of course as an employment blog we'll read the x-axis as average employer rating and the y-axis as interview requests.
Notice the clear upward trend. Notice also that it is an accelerating upward trend and not just a straight line relationship. The OKCupid folks calculate the positive slope, but then noticed that there was also still a lot of scatter around the straight line they drew. They found that in addition to the average rating being predictive of getting messages, the variability of the ratings was also predictive. All else being equal, it was better to have variability in the profile of ratings. Imagine two people who both have an average rating of 4.0. If one had all ratings of 4.0 (i.e., no variability) and another had some variability, the second person would be expected to get more messages. (Hopefully you see that this is because that person must have more 5 ratings than the other person…but we'll get to that.)
Okay OKCupid, so far so good. But next comes the egregious error. They decided to construct a regression equation that used all the individual rating profiles to predict the number of messages received. As inputs to their regression they put the number of 1 ratings, the number of 2 ratings, the number of 4 ratings and the number of 5 ratings (they left 3 out because it caused some redundancy).
Now it would have been helpful for them to have given the uncertainty in those regression weights, but let's just see how they interpreted them. Correctly, they noticed that the largest positive weight was given to the 5 ratings. Indeed, there is almost a 1-1 payoff in that for every additional highest rating someone receives, they are expected to get .9 more messages. But then they went on to claim that the lowest category appears to have the next highest positive association. They actually conclude that the next best thing to getting a 5 rating is to get a 1 rating. By their logic, it would be better to be a person who has 10 of the worst rating (expected messages = k + .4*10 = k + 4) than to be a person who has 100 of the 4 rating (expected messages = k - .1*100 = k -10). Really??
Where did they go wrong? First, they looked at the individual parts of the equation without realizing that it has to be looked at as a whole. You can't just imagine adding or subtracting specific ratings without thinking about the whole profile. The number of 1, 2, 3, 4 & 5 ratings received are interrelated - the more high ones you have, the fewer low ones and vice versa. It's not easy to imagine dialing up and down the number of low ratings while holding everything else constant. So because the rating counts are so interrelated, the regression weights are also interrelated, and they should not be interpreted on their own. Otherwise, you quickly come to silly examples such as it is better to receive all low ratings than to receive all 4 ratings. That just can't be true. Second, they are ignoring that receiving a lot of 1 ratings has two meanings: it might mean you're very unpopular, but it also might mean your profile has been rated a whole lot of times and when that happens ratings will accumulate in all the slots from 1 through 5. When predictors in a regression have double meanings like this, you often see some paradoxical behavior. In this case, 1s on their own are probably neutrally or negatively related to number of messages; but when the number of 4s and 5s are also included, things can change. And finally, the association between messages and ratings, as seen in the first graph, is non-linear meaning that the pattern of regression weights will favor the highest category. The weights were [.4, -.5, -.1, .9]. It's not a coincidence that the graph has a non-linear feel, and that those weights trace out a curve.
Students in an introductory statistics class would easily spot the errors in the OKCupid analysis and realize that the authors had jumped to an unsupported conclusion. But judging from the retweets and the Facebook shares, people are just running with the study's conclusion and not bothering to evaluate the evidence. Let me be clear - if you are a job seeker, it would be a ludicrous strategy to say, "Gee, if I can't get prospective employers to rate me as the best possible candidate, the next best thing I can do is get them to rate me as the worst possible candidate." Such a strategy would be just flat out….well, I don't want to be rude but I'm thinking of a word that rhymes with "cupid".


